Despite some positive predictions of the supply chain’s recovery, supply chains are getting tangled across the globe. From China to Denmark, this new situation is sparking re-examinations of things as macro as globalisation itself and micro as trucking efficiency around ports.
As for the big picture, the intertwined world economy took decades to stitch together and will take years to play out, however it evolves. In the meantime, economists are squinting to see the more granular, short-term shifts that the pandemic and Russia’s war in Ukraine are forcing on consumption, investment, production, and trade.
Some observers say now is a good time to focus on different metrics than traditional measures of employment, prices, and gross domestic product.
“The way we look at the global economy needs to change,” said Steven Barrow, a currency strategist at Standard Bank. “No longer should we look at growth, inflation, and monetary policy through the lens of demand. Instead, it is supply that’s key.”
Before the pandemic, the supply of goods and services was what economists would generally call “elastic”, flexing easily to match demand. “But now supply has turned from being elastic to inelastic, meaning that the response to changes in demand are far less,” Barrow said in a note.
With that in mind, there are a few unorthodox supply-side scopes to observe, with one such as below:
- Heat Maps
Many economists, including the team at Bloomberg, have developed indexes or colourful heat maps to show the degree of stress on supply lines. In a research note last week, BNP Paribas SA analysts released their latest tracker, and it showed some April indicators flashing orange and yellow.
They look at traditional gauges like delivery times and order-to-inventory ratios, along with alternative numbers like air cargo rates and the number of anchored vessels outside the Port of Los Angeles. “Disruptions are back and here to stay,” they wrote.
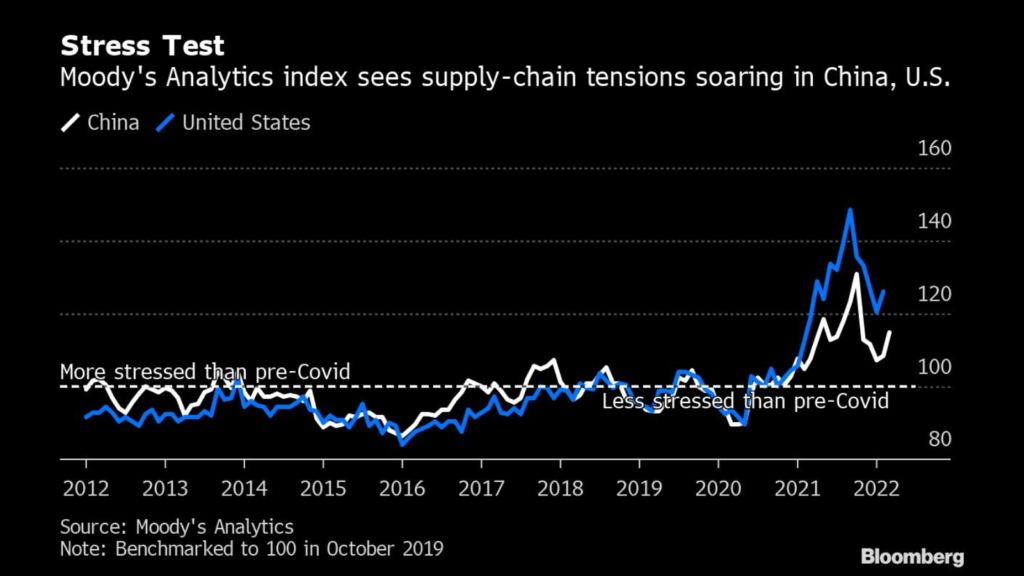
A Moody’s Analytics measure shows supply stress in the world’s two biggest economies, the U.S. and China, is still hovering well above the pre-pandemic norm.
“Disruptions stemming from the Ukraine conflict steepened those graph lines in February, but now the cause lies primarily with China’s Covid-related woes, which have forced 15% more ships to wait in waters off the ports of Shanghai than at the same time last year, “said Steve Cochrane, the firm’s Asia-Pacific chief economist. “That’s reversing the improvement that started in the final quarter of 2021,” he added.